Power of 3D GPX Tracks
Hi there!
The 3D GPX track feature adds a new dimension. It not only displays the route's elevation but also offers additional data visualization, including speed, altitude, slope, and heart rate (sensors data), for example. This comprehensive view helps users analyze their performance and better understand the dynamics of their route in a realistic 3D environment.

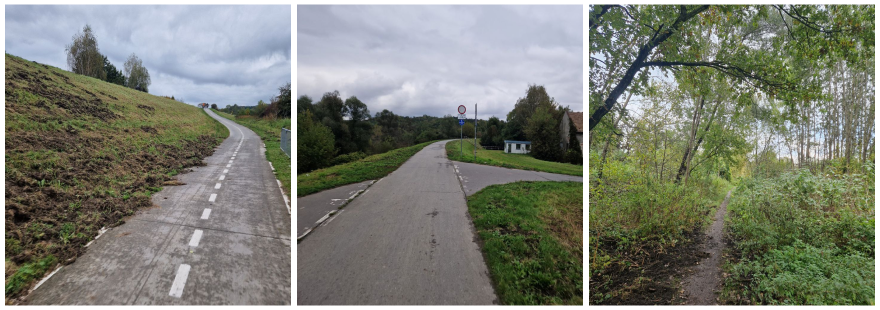
On a bike ride, I use OsmAnd to record my track, while my heart rate is monitored with a sensor. Conditions are constantly changing throughout the ride, terrain, road surfaces, and weather all affect how the trip unfolds.

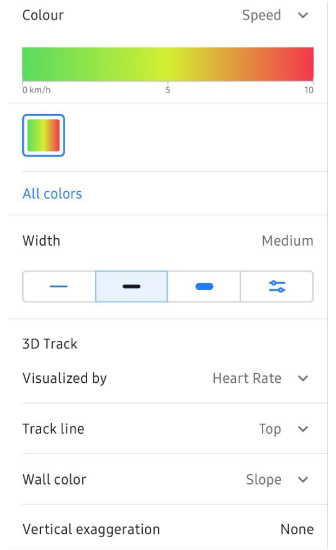
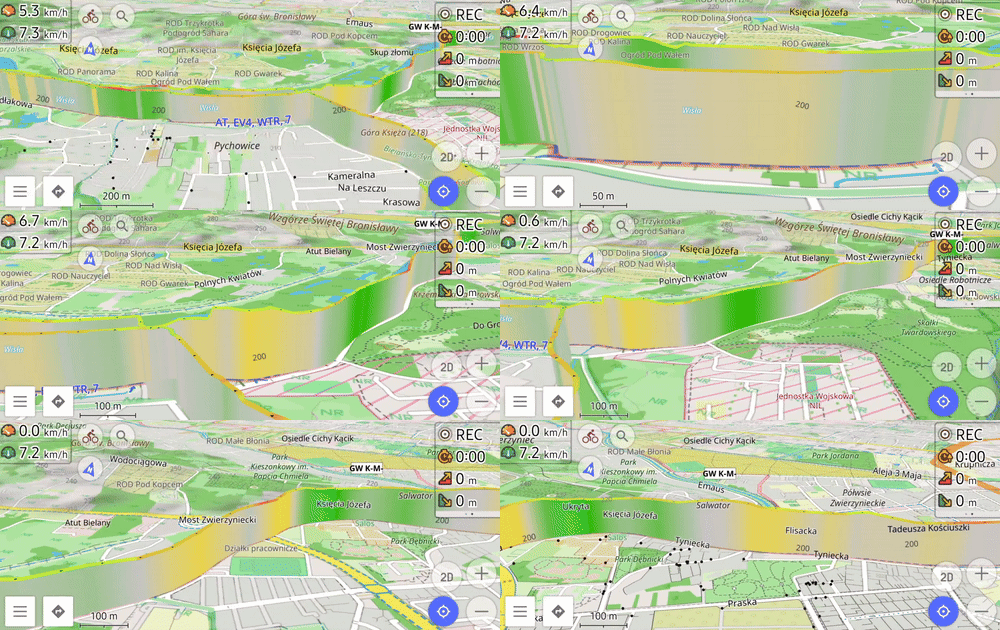
After the ride, I can analyze my trip in detail using the 3D track mode. The track is displayed in three dimensions, making it easier to study:
- 3D track wall height shows my Heart rate changes,
- 3D track wall color represents Slopes,
- track line color itself reflects my speed.

This detailed view helps me understand how my physical performance and the conditions changed throughout the ride, allowing me to improve my training efficiency and better plan future trips.

OsmAnd allows you to record track data from various sensors, such as heart rate, temperature, bicycle power, or speed sensors, and afterward provides a comprehensive analysis. You can visualize how different aspects such as heart rate, speed, and slope interacted during your ride, all in one detailed 3D representation of the track.
The 3D GPX track feature is a powerful tool for those who want to gain a deeper understanding of their performance and riding conditions.
-
Follow:
Follow OsmAnd on Facebook, TikTok, Twitter, Reddit, and Instagram!
-
Join:
Join us at our groups of Telegram (OsmAnd News channel), (EN), (IT), (FR), (DE), (UA), (ES), (BR-PT), (PL), (AR), (TR).
-
Get: